Visualizing probabilities with histograms
The future is uncertain, and one of the best mathematical tools we have for coping with this fact is the distribution of probability. Lokad features both a probabilistic forecasting engine and an algebra of distributions. These two capabilities get along pretty well when it comes to dealing with complex, erratic and very uncertain supply chain situations. At their core, these capabilities rely enormously on processing distributions of probabilities. Yet, until recently, Lokad was lacking convenient ways to visualize these distributions.
As a result, we have introduced a new tile - the histogram - which is specifically intended for visualizing the distributions of probabilities. The histogram can be used to visualize a synthetic distribution:
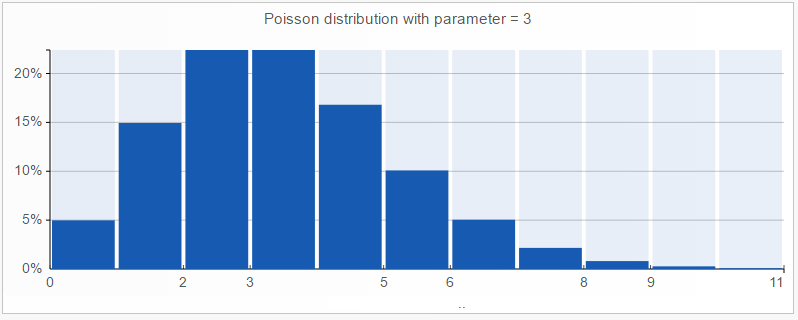
The above graph has been obtained with the following script:
show histogram "Poisson" with poisson(3)
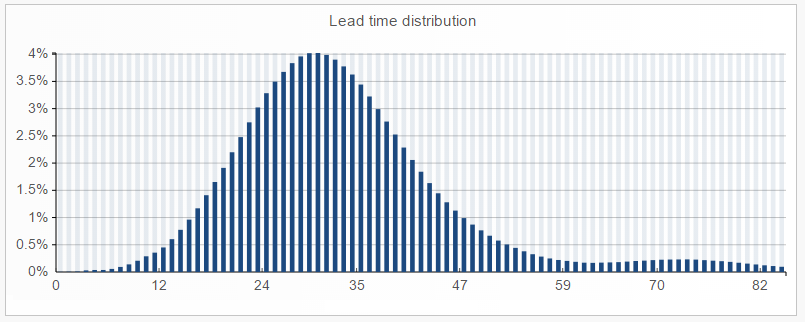
The uncertainty of the future lead time can be visualized with:
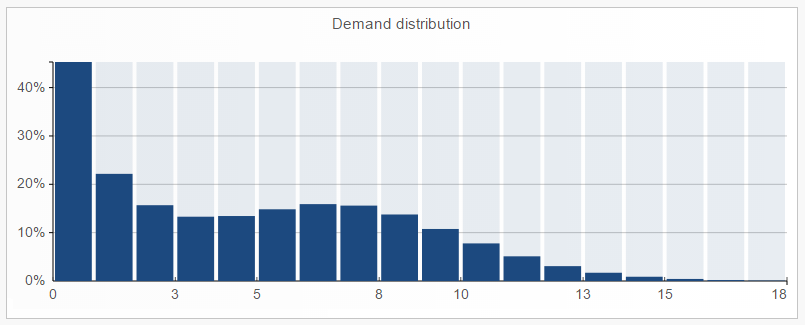
Similarly, an uncertain future demand, integrated over an uncertain future lead time, can be visualized with:
Classic forecasts - where the future is supposed to be known - are comfortable and intuitive. Yet, unfortunately, they happen to be deeply wrong as well, and routinely lead to grim supply chain results. Therefore, out of necessity, we remain stuck with probabilities. Nevertheless, with proper visualization tools, we hope to make these probabilities a bit easier to handle.


