Forecasting Climate Change like a Supply Chain Planner
Transcript of the talk given by Joannes Vermorel at the Ecole polytechnique in Palaiseau (France) on Friday, June 3rd for the symposium Artificial Intelligence, Digital and Climate Change. The symposium was organized by Sylvain Le Corff, Professor at Telecom Sud Paris and Eric Moulines Professor at Ecole polytechnique and elected member of the Académie des sciences.
My competence lies in supply chain science and in supply chain predictive analytics. Supply chain is, roughly speaking, the glue between production and consumption: materials must be acquired, transported, transformed, and distributed. This is what supply chain is about. I will immediately confess that supply chain science is unlikely to be the future of climatology.
However, modern supply chains are already leveraging automated forecasting techniques at scale. This is exactly what my company, Lokad, has been doing for over a decade.
During this decade, I have learned a series of critical lessons when it comes to the use of predictive techniques, typically machine learning algorithms, in real-world settings. The most important lesson is that it’s better to be approximately right rather than exactly wrong. Yet, when I look around, I see tons of deeply misguided data science efforts.
The most insidious aspect of crunching the data is that the algorithms – or the technology – may give an illusion of rationality, an illusion of science. Yet, too frequently, those misguided data crunching efforts yield conclusions that are no better than astrology. No algorithm will ever save you if you approach a problem the wrong way.
To understand how predictive modeling for supply chain can give us valuable lessons for forecasting climate change, let me point out that the climate and global markets have a lot in common. In both cases, our way of life is at stake. In both cases, we have complex systems that are not fully understood. In both cases, each participant has an impact on the system, but it’s a small impact. In aggregate, a series of small impacts may yield a big impact. Yet, participants have incentives of their own, and as such, nothing is ever simple.
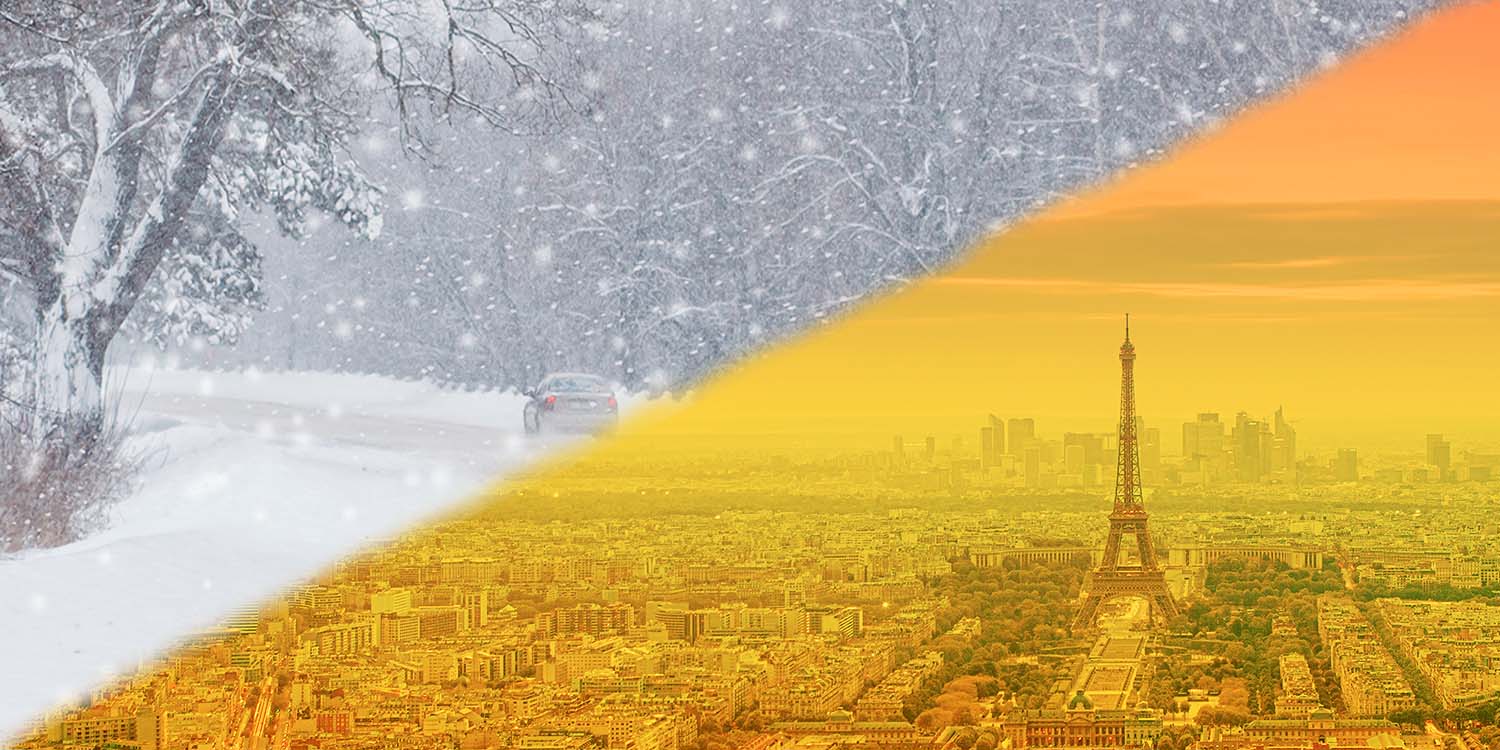
Thus, I am going to assess, supply chain style, the evolution of the climate from the French Metropolitan perspective, just like a company uses its own market shares to assess the market.
Supply chains taught me that the cost always lies in the extremes. Small excesses of production and minor shortages are usually trivial to fix; it’s the big ones that spell the doom of companies. Thus, when forecasting climate change, as a supply chain planner, it’s not the small variations that interest me. France has a mild climate; and remember that I am adopting here a perspective centered on France.
France would have little or no problem to accommodate temperatures two degrees higher or lower on average. Similarly, we could have 10% more wind, or less wind, or 10% more rain or less rain, it would make almost no difference. Let me immediately clarify that I am not saying there wouldn’t be any impact. I am merely pointing out that other countries - like the Denmark or Italy – have no long-term problem associated with colder or warmer climates – while maintaining a lifestyle that, for all intents and purposes, is nearly identical to the one we enjoy in France. As the climate changes, adjustments would happen in a whole series of areas ranging from the choice of crops for agriculture to the thickness of the thermal insulation layers in buildings. However, those evolutions are modest compared to other sources of change impacting France.
Thus, as a supply chain planner, it’s the climate extremes that capture my interest. To assess what can be expected, we need to look at the historical extremes. Indeed, future extremes should always be estimated as larger than past extremes. This is true for markets and most likely true for the climate. Thus, let’s have a look at what the history of France tells us.
Summer 16361, it’s the year when Corneille wrote Le Cid, but also the year of a terribly hot summer. Temperatures rose to 39°C in Paris for weeks. In one summer, there were 500,000 deaths, mostly babies and infants. The primary cause of death was contaminated water, and diseases like dysentery. The death toll, relative to the French population at the time, is comparable to the one of WW1, which lasted a bit more than 4 years.
Thus, a sustained 39°C for the entire summer, for France as a whole, should the baseline of what we should be ready for. There is almost no climate modeling involved in this proposition: it’s a direct reading of recent French climate history. If it did happen 4 centuries ago, my proposition is simply that it may happen again next summer.
Naturally, over the last 2 centuries, medical science and sanitation have pretty much eliminated dysentery in France. However, does it mean that we can go through hot summers without any trouble? If we judge by the recent events of summer 2003 in France, hot summers still present serious risks. The heat wave of 2003 barely lasted 2 weeks, reaching 39°C in Paris, and caused 15,000 deaths in France2, primarily among elderly people. However, in the years that followed, the rate of air conditioning equipment in homes in France went from 4% in 20053 to 25% in 20204.
Here, we are touching on a critical aspect of forecasting human affairs: people observe, and people adapt. This does not always negatively impact the forecasting accuracy - although it frequently does - but human ingenuity almost always contributes to making long-term forecasts irrelevant. Indeed, keep in mind a forecast, any forecast, is first and foremost a choice of model. The model defines the battleground: what is going to be forecast. A forecast can be very accurate and yet completely irrelevant. This is a danger faced by every company operating a supply chain: markets are changing in nature, not just growing, or shrinking.
Back to our climate extremes, let’s now have a look at the great winter of 1709 . During the month of January 17095, temperatures drop to -20°C in Paris; this is like a cold winter in Quebec City. The Seine River is frozen solid like the other great rivers of France. In 11 days, France loses 100,000 people due to the cold wave. In total, the winter claims 600,000 people, mostly poor families. Again, those losses are comparable with the full impact of WW1 in France, except that, once again, the disaster happens in a matter of weeks, instead of years. This winter was part of a period known as the Little Ice Age in Europe which lasted from mid-13th century to mid-19th century.
While having the Seine River frozen solid in Paris may come as a surprise to this audience, it’s worth noting that the North latitude of Paris is 49° while the latitude of Quebec City is only 47°. So, geographically, Paris is more in the north than Quebec City.
In any case, in the past centuries, the Seine River froze solid many times. It’s a matter of history, no climate modeling involved. If such a winter did happen 3 centuries ago, my proposition remains that it may happen again next winter.
Thus, let’s consider the sort of problems that would arise in France, if we were to suffer a Canadian winter like what happened in the past.
The first problem that I can think of is: water. In France, water pipes are typically buried 80cm deep, but in Quebec City, it’s 130cm and for good reasons. At 80cm, pipes freeze and break in Quebec. Thus, a great cold wave, in France, would most likely destroy a sizeable portion of our water distribution infrastructure.
Also, transport would be impacted severely. Canadian trucks use block heaters because diesel freezes at -10°C. I do not have statistics on the prevalence of block heaters on trucks in France, but the equipment rate appears to be very limited. Considering that we have more than 98% of professional vehicles that operate on diesel, it’s reasonable to assume that almost all those vehicles would become inoperable during a great cold wave.
Finally, the power grid is also likely to suffer severe black outs . In 20126, which was a cold winter, France was importing up to 9% of its electricity from Germany. The portion of power that can be shut down at will, mostly with large industrial companies, yields only about a 1% energy reduction. A controlled brown-out yields roughly an extra 3% of energy reduction. Beyond this point, the only option left for the power grid is to cut off portions of the grid.
Those problems are not theoretical. It turns out when I discussed the case of great winters with my father, that those problems are exactly what happened in Saint Etienne in 1956 .
1956 was the coldest winter of the 20th century in France. In Saint Etienne, the power grid did collapse. Water pipes did burst. Vehicles did cease to operate. In the south, even the seaport of Marseille froze solid.
Families went without water, food, or heating for days. A cursory inspection of INSEE death statistics for February 19567 indicates about 15000 excess deaths compared to the years before.
This harsh winter of 1956 happened in a post-war society that still had little reliance on electric appliances . Also, this society was still extensively using wood heating, which does not depend on the power grid. I have no doubt that the same winter over Europe today would have much more severe consequences.
Back to our climate forecasting discussion, it is clear, at this point, that it’s not future temperatures that truly matter, it’s the consequences of those temperatures. The same could be said for all the other climate variables: wind, rain, etc.
If the first “data science” forecasting mistake is to focus on the averages rather than to focus on the extremes; then, the second forecasting mistake is to confuse numerical artefacts with real-world consequences. In supply chain, this insight is summarized as percentages of forecasting error are irrelevant, only dollars of error matter.
Indeed, forecasts are numerical artefacts that are engineered to support decisions. The quality of those forecasts very much depends on their adequacy to ultimately reach better decisions.
Assessing the quality of forecasts relying only on arbitrary statistical indicators like the mean absolute error (MAE), the mean square error (MSE), or the mean absolute percentage error (MAPE), which are all fully disconnected from real-world consequences, is probably one of the most common mistakes that I observe among my fellow data scientists.
I personally refer to those forecasts as naked forecasts. Naked forecasts are like the opposite of mythical prophecies. Those forecasts get much more attention than they should, and when people pay attention to those forecasts, they only make the situation worse.
To understand why naked forecasts are wrong, one has to realize that, in the supply chain – and I suspect in the climate as well – it is straightforward to generate forecasts that are both extremely accurate, and extremely stupid at the same time.
Indeed, let’s consider a minimarket with daily replenishments. For almost all the products of the minimarket, the most accurate daily sales forecast is zero units. Indeed, most products, in a minimarket, are not even sold once per day on average. Thus, a zero-sales forecast is usually the most accurate daily forecast considering the mean absolute error.
Then, if a zero-sales forecast is taken as an input, the store will replenish nothing. Indeed, zero projected sales means zero units to be replenished. Soon enough, all the shelves of the minimarket are empty, and thus, we have effectively zero sales, making this zero-sales forecasting model 100% accurate. Meanwhile, the minimarket goes bankrupt.
This situation happens in real-life (with enterprise software solutions that compete with Lokad). It’s called an inventory freeze problem. To fix it, the model must forecast the demand instead of forecasting the sales; however, this is difficult, because sales are observed while the demand is not.
More generally, statistical forecasting metrics give the illusion of science: I have engineered a forecasting model that is 1% more accurate, thus, my model is provably better. However, this is usually not the case, and I am not even talking about overfitting. The problem that I am pointing out is that chasing a statistical metric invariably makes the model worse. The forecasting model becomes exactly wrong while it used to be approximately right.
I am no climate expert, but from my supply chain vantage viewpoint, in the media – the press but also social networks – I see an abundance of naked climate forecasts: forecasts that are not attached to any practical decision-making process. I am not challenging the accuracy of those forecasts; this is a debate for climatologists. However, my supply chain experience tells me that trying to infer any kind of real-world decisions based on those naked forecasts is a recipe for unintended consequences, typically wasting tons of resources in the process, and frequently achieving the very opposite of whatever the original intent was.
A good forecast starts with a problem to be addressed. Once the problem is adequately characterized, we progress backward identifying the data and the numerical recipes that are suitable to support whatever decision is at stake.
On the contrary, a bad forecast starts with a dataset that happens to be luckily available and with a data scientist that happens to be eager to test that the latest machine learning paper on this very dataset, possibly a paper written by the data scientist himself.
Thus, my conclusion, which applies to the supply chain and the climate alike, is that if you want to sort out the good forecasts from the bad forecasts, start by immediately rejecting naked forecasts. Nothing good ever comes from those forecasts. Then, make sure that the forecasts are approximately right, as opposed to being exactly wrong. And finally, look for the proximity of those forecasts to real-world decisions. If the people making the forecasts do not have to live by the consequences of those forecasts, then, your default position should be of profound skepticism.
-
Page 351, Histoire humaine et comparée du climat. Vol 1 : Canicules et glaciers. XIIIe-XVIIIe siècles, Emmanuel Leroy-Ladurie, Fayard 2004 ↩︎
-
RAPPORT FAIT AU NOM DE LA COMMISSION D’ENQUÊTE SUR LES CONSÉQUENCES SANITAIRES ET SOCIALES DE LA CANICULE, Rapporteur M. François d’AUBERT, N° 1455 - tome 1, February 24th, 2005. ↩︎
-
Le marché de la climatisation s’enrhume, Valérie Leboucq, Les Echos, October 7th, 2005. ↩︎
-
LA CLIMATISATION : VERS UNE UTILISATION RAISONNÉE POUR LIMITER L’IMPACT SUR L’ENVIRONNEMENT, ADEME presse, June 30th, 2021 ↩︎
-
Page 517, Histoire humaine et comparée du climat. Vol 1 : Canicules et glaciers. XIIIe-XVIIIe siècles, Emmanuel Leroy-Ladurie, Fayard 2004 ↩︎
-
La vague de froid de février 2012, RTE ↩︎
-
Démographie - Nombre de décès - France métropolitaine, Identifiant 000436394, INSEE ↩︎


